Developing a transit desert interactivedashboard: Supervised modeling for forecasting transit deserts
Study area and distribution of public transit stations.
Flow chart of supervised modeling for forecasting transit deserts and validation.
Identified transit gap in peak-time period using aggregated demand.
Transit gap in peak-time period using aggregation and disaggregation by sex.
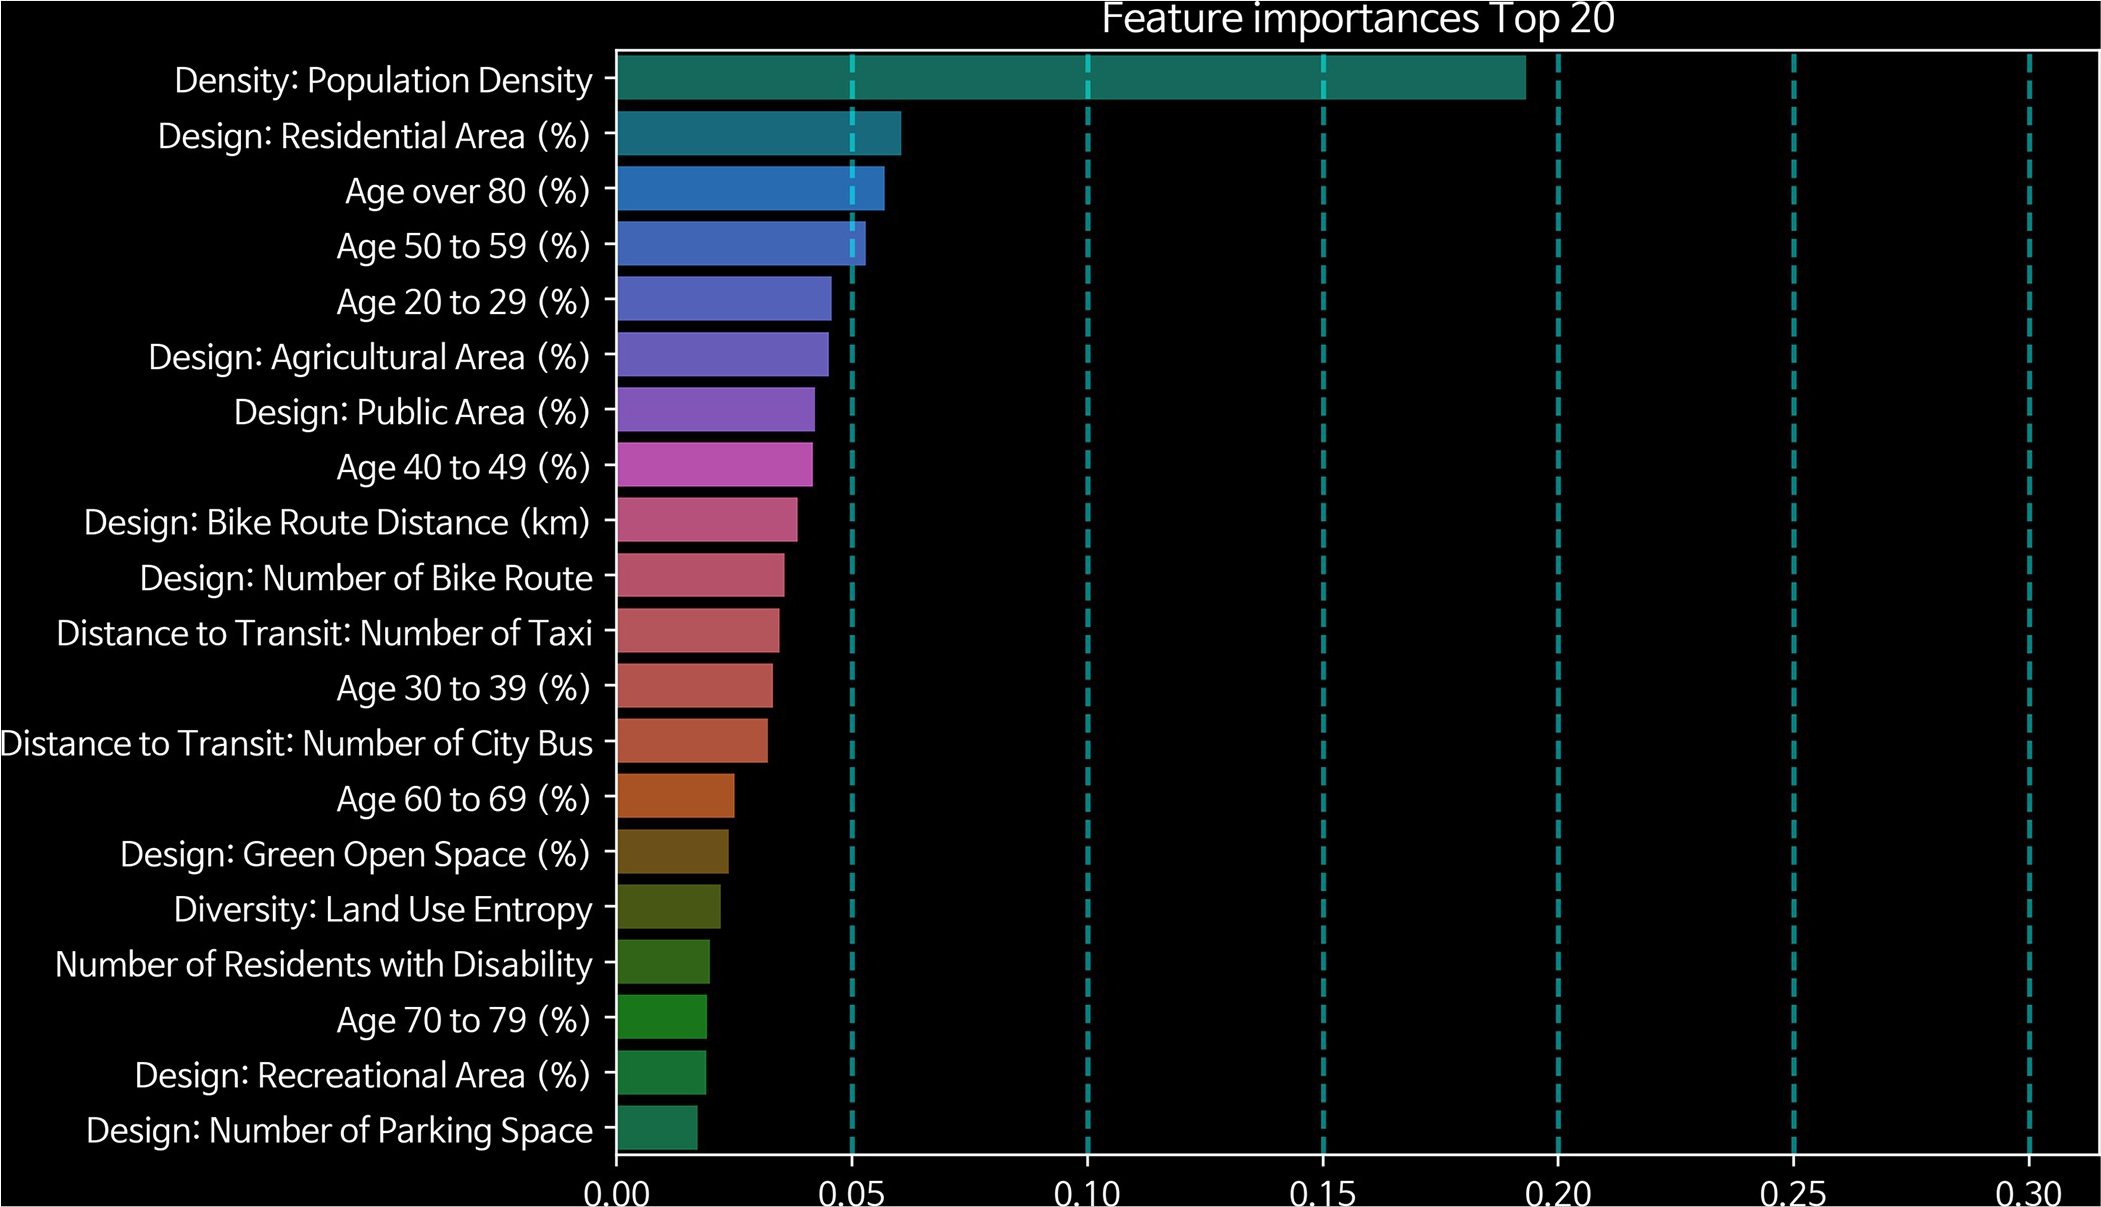
Feature importance in trained Random Forest model.
Abstract
Transit deserts are areas where transit demand exceeds supply. This study not only identifies these regions but also proposes actionable solutions using a multi-class supervised machine learning framework. Focusing on peak times and gender differences in demand, the study evaluated several models and selected the Random Forest method. Key factors such as density, design, distance to transit, and sociodemographic characteristics significantly contribute to transit deserts. Reducing population density and increasing green spaces can help transform these areas. The study highlights pronounced disparities in transit services for women and developed a machine learning-powered interactive dashboard to enhance community engagement and improve planning practices through AI and participatory planning approaches.
Team
Seung Jun Choi, Junfeng Jiao
Supporting information
S1 Table. Descriptive statistics.
(DOCX)


