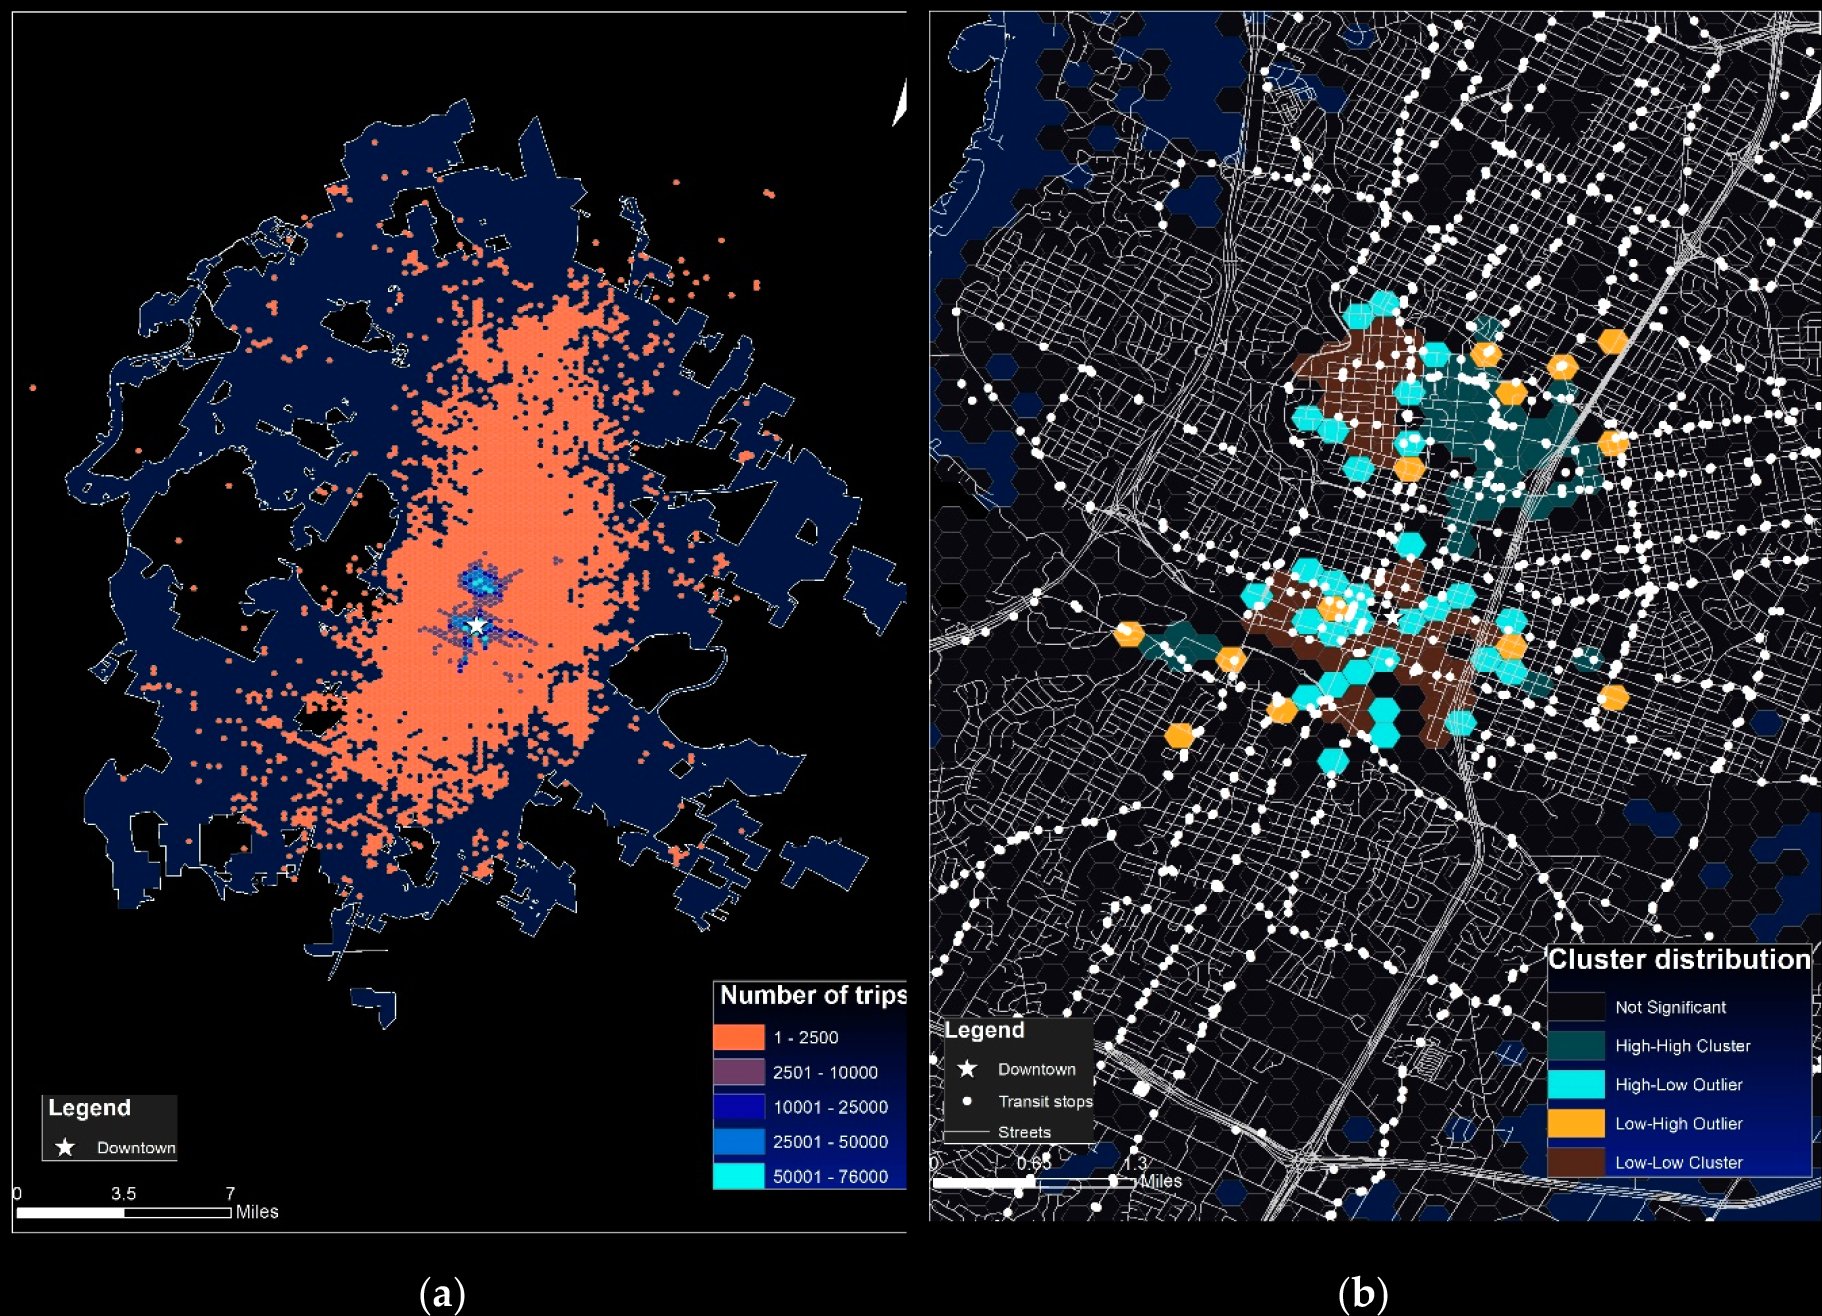
This paper examines the travel patterns of 1.7 million shared E-scooter trips in Austin, TX, spanning from April 2018 to February 2019. With over 6,000 active E-scooters monthly, these trips covered approximately 117,000 miles. During this period, the average trip distance was 0.77 miles, lasting 7.55 minutes. Two primary E-scooter hotspots were identified: Downtown Austin and the University of Texas campus. Spatial analysis revealed more trips originating from Downtown than being completed, with the opposite trend observed for the UT campus. The study also explores the relationship between E-scooter trips and surrounding environments, finding correlations with higher population density, residents with higher education levels, proximity to the city center, presence of transit stations, better street connectivity, and compact land use. Unexpectedly, the proportion of young residents within neighborhoods showed a negative correlation with E-scooter usage.


